Part 2 here Basic Logging & Debugging in Microservices - Part 2
ElasticSearch for storing the log data
At this time, you may have a good logging library that you built on your own. Your application
probably produced a bunch of log entries and you can debug your application using cat and tail
command. You can also open the log file in your favorite text editor and search for the log entries
that you want. However, there should be a better solution for that. Imagine when your log file grows
to thousands or millions or even billions of lines, that’s not feasible to debug manually like that.
Fortunately, ElasticSearch is a good choice for organising log entries. Setting up ElasticSearch is a quite straight forward task. There is even pre-built docker image for it. Our team at AR doesn’t even care about optimising it because we rarely face the problem with it. Of course, our ElasticSearch instance goes down sometimes, but since it’s not a critical module of the system, doesn’t affect main application’s status, we don’t need to invest much time in optimising it. What we do is to configure restart policy so that Docker can recover the process after OOM. Another thing we need to do is to set up a daily script for deleting the old log entries to save the disk space. You can find installation instructions for ElasticSearch on its official Docker image page
fluentd for pushing the log data to ElasticSearch
Now you have your ElasticSearch server up and running. The next thing you need to do is to push
your log data to it. fluentd, an open source data collector for unified logging layer, allows you
to unify data collection and consumption for a better use and understanding of data. If your application
writes all the log entries into a file or to standard output inside Docker,
you can set up fluentd to tail the log files and push to ElasticSearch every time one line is
finished (just like the tail command). In case you don’t know, Docker redirect its standard output
to a file on disk. You can find a sample fluentd setup here
https://github.com/tmtxt/clojure-pedigree/tree/master/images/fluentd.
The most important thing that you need to notice is its configuration file, the td-agent.conf
file. You will need to modify it to fit your requirements
<source>
  type tail
  # configure the path to your log files here
  path /var/log/*.log
  pos_file /var/log/services.log.pos
  # other configurations
  ...
</source>

<match **>
   type elasticsearch
   log_level info
   include_tag_key true
   # remember to output your log in logstash format
   logstash_format true
   # configure the elastic-search connection here
   host log.elasticsearch
   port 9200
   # other configurations
   ...
</match>
Note: remember to output your log entries in logstash format (see logstash_format true)
Kibana for searching and displaying the log
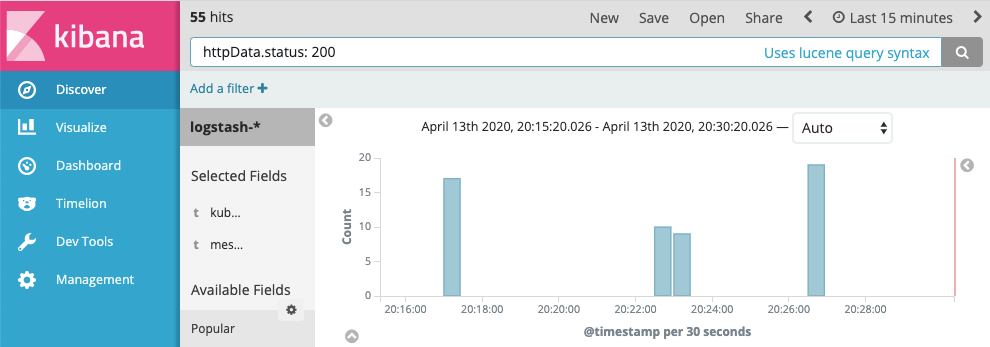
Everything is on track now, you will need an UI for searching and displaying all the log data. Kibana is a simple solution for that purpose. Again, setting it up is an extremely easy task, especially with Docker. Just pull it from the official Docker page, start it with the environment variables pointing to your running ElasticSearch server and you are done. Here are some sample images from my personal project, quite nice, huh?
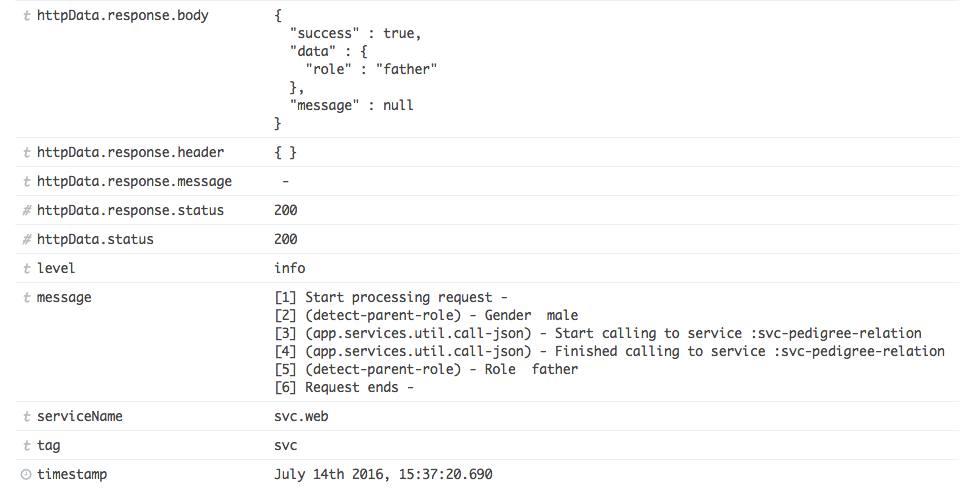
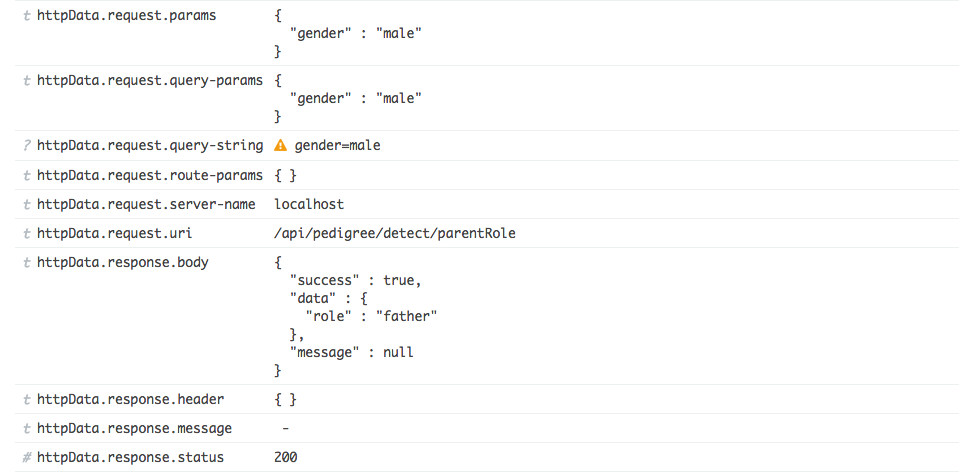
You can easily and quickly filter your log data using the properties you added as the key, for example
Some Notes for Logging
Logging is a simple task, but to do it the right way, you need to consider these things
- If you log too little, you won’t have enough data to troubleshoot. However, if you log too much, it takes more resources for your server to serialize a log entry. Choose only the necessary data to log, don’t log everything.
- Logging should not affects the main application logic. Always wrap
try/catcharound your logging code so it doesn’t throw error to the users if there are any problems with it. - Logging should be asynchronous. The request should not wait until the logging serialization is done to return the data to the users.
- Log the important data as the log properties so we can query easily in Elasticsearch, for example,
the
customerId, theuserIdwho initiates the request or thecorrelationIdto link different requests. - Make logging a compulsory part of your development process