Why I need a Log trace
There are many logging libraries for Clojure and Ring out there which support basic logging per each request that Ring server handles. However, all of them produce multiple log entries per request, one when the request starts and one when the request ends. Also, they cannot log the steps happen inside the handler function’s execution. For example, with Ring-logger, the default setup logs:
- an :info-level message when a request begins;
- an :info level message when a response is generated without any server errors (i.e. its HTTP status is < 500);
- an :error level message when a response’s HTTP status is >= 500;
- an :error level message with a stack trace when an exception is thrown during response generation
If there are multiple requests that process at the same time, the log entries in the log file could be something like this
- Starting request 1
- Starting request 2
- End request 2
- End request 1
That’s hard for me unite all the logs into one place and search the all the related log information whenever debugging one specific request. There is also no way for me to track the flow of execution steps inside the handler function of that request. Although I can simply do (timbre/info "Start some database queries"), the problem than come back to the previous one
- Starting request 1
- Starting request 2
- Start a query for request 1
- Start a query for request 2
- Write file for request 2
- Write file for request 1
- End request 2
- End request 1
Hmmm. Something like this would be much better
- [1] Starting request {id}
[2] Start query to database
[3] Found one record
[4] Processing data
[5] Finished request {id} in 20ms - [1] Starting request {id}
[2] Start query to database
[3] Exception: database down
[4] Finish request {id} in 10ms
What I want is one single log entry per request with the trace of its steps so I can easily find out how the code works as well as where it can break, where it doesn’t function normally.
The wrap-log-trace middleware
Since almost everything in Compojure Ring are triggered through the request handler, so I can simply define a thread-safe global log data variable and wrap each request inside my custom log trace middleware to mutate that global log data. For example
(ns app.logger.log-trace
  (:require [slingshot.slingshot :refer [try+ throw+]]))

;;; The var that contains all the logging information for this request
;;; messages: a vector containing the steps executed inside the request
;;; request & response: the request and response data, will be populated later
;;; correlationId: the id that exist along way with the request through multiple services in the system
(def ^:dynamic *log-data*
  {:messages        []
   :serviceName    "svc.web"
   :processTime    nil
   :request        nil
   :response       nil
   :correlationId  nil})

...

(defn wrap-log-trace [handler]
  (fn [request]
    (binding [*log-data* (make-pre-request-data request)]
      (try+
       (let [response (handler request)]
         (handle-no-exception response))
       (catch Object ex (handle-exception ex))))))
That’s basic idea. Before each request, the make-pre-request function will extract and store all the necessary request information into the global *log-data*. The handler will then try catch the request processing and log the response data as well as the error stack trace if it happened using handle-no-exception and handle-exception functions. I will talk about the detailed implementation of each function and the log-trace namespace later.
Now, to use this, we need to include it in our routes handlers. If you use Compojure (I hope you use that 😄), it offers a wrap-routes function to wrap your middleware only after the request has matched the route. By that way, I can easily ignore logging for unnecessary routes like assets or images routes.
(def app
  (-> (routes (-> home-routes
                  (wrap-routes log-trace/wrap-log-trace))
              (-> auth-api-routes
                  (wrap-routes log-trace/wrap-log-trace))
              app-routes)
      (wrap-params)
      (wrap-multipart-params)
      (wrap-session)
      (wrap-json-response)))
Process with Request and Response data
So, all the setup is done. Now it’s time to add some implementation to process the data that is sent to and back from our application. request and response are merely Clojure maps so you can easily extract whatever you want using basic Clojure get and get-in syntax. For example
make-pre-request-datafunction
(defn- make-pre-request-data
  "Create the default log data from the request, used when start processing the request"
  [request]
  {:messages        [{:level "info"
                     :title "Start processing request"
                     :data ""}]
   :serviceName    "svc.web"
   :startedAt      (c/to-long (t/now))
   :request        (process-request-data request)
   :correlationId  (get-correlation-id request)})
Add data to your log trace
You also need a way to add data into your log object to track the request. Let’s implement the most
important function right now. This function simply adds a new entry into the :messages vector in
*log-data* so that later when the request finishes, you can extract all the steps inside the
request handler.
(defn add "Add new entry to the log trace" [level title & data]
  (let [messages (get *log-data* :messages)
        messages (conj messages {:level level
                                 :title title
                                 :data data})
        log-data (assoc *log-data* :messages messages)]
    (set! *log-data* log-data)))
You can use it in code like this. There is no need to wrap it inside binding since you already did
that with the wrap-log-trace middleware.
(defn- detect-parent-role
  "Detect parent role."
  [request]
  (let [gender (-> request util/params :gender)
        _ (log-trace/add :info "(detect-parent-role)" "Gender " gender)

        role   (svc-pr/detect-parent-role-single {:gender gender})
        _ (log-trace/add :info "(detect-parent-role)" "Role " role)]
    (util/response-success {:role role})))
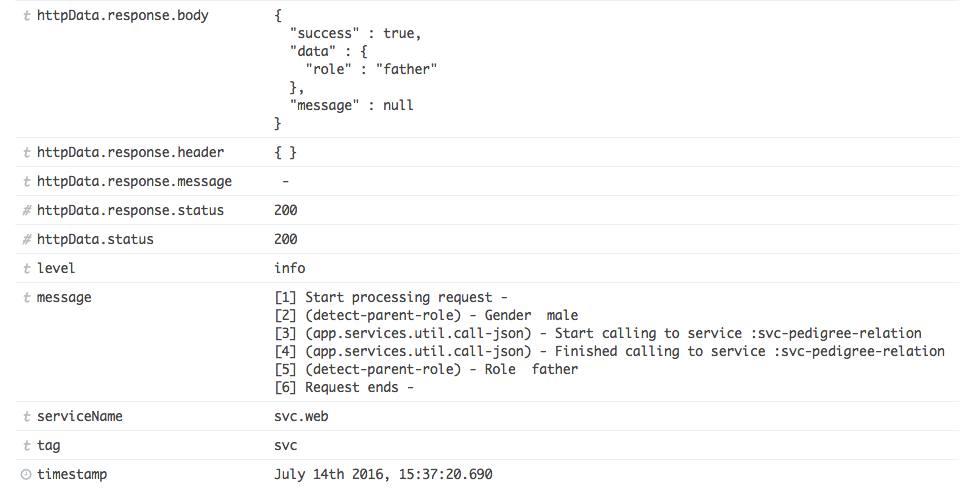
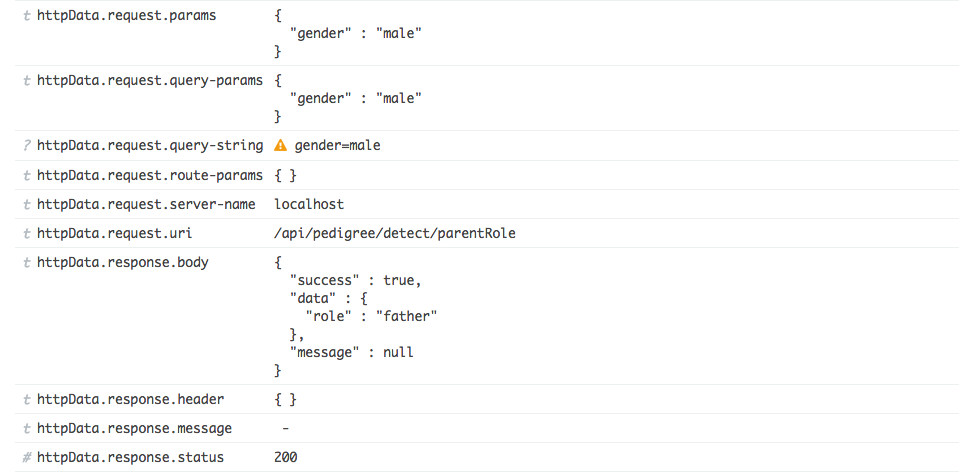
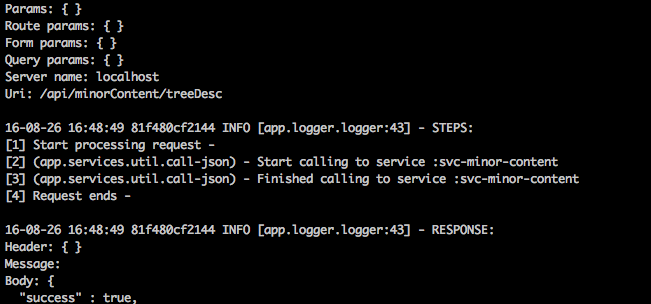
Write the log and get the result
I will not talk about how to write the log here. There are plenty of libraries out there that you
can use. Writing the log is simply processing the *log-data* that you already have. Using
Timbre,
I can get the output like this for each request
Extra: Logging with ElasticSearch, Fluentd and Kibana
This is an easy setup but can bring huge effect. With the help of ElasticSearch and Kibana, you can easily search for the desired log entries and filter them using time or value. All you need to do is to adjust Timbre to output the log to the right json format, config fluentd to follow the log to push to ElasticSearch and Kibana will take care the rest for you. Here is a sample Dockerfile for fluentd and docker-compose file setup for that combination.